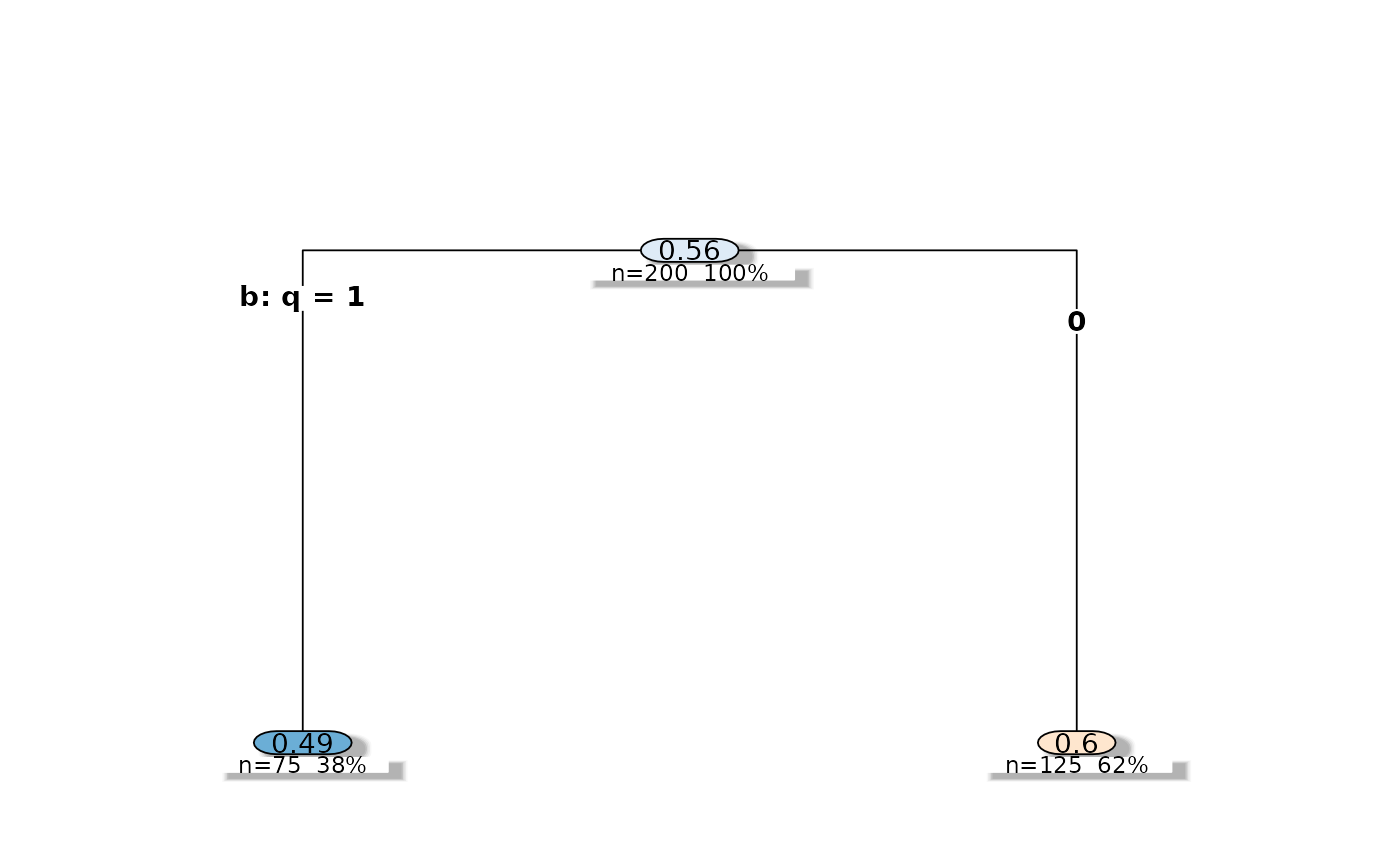
Renders the decision tree using rpart.plot::rpart.plot().
Usage
# S3 method for class 'cjdiag_tree'
plot(x, ...)
Arguments
- x
A
cjdiag_treeobject fromcj_fit()- ...
Additional arguments passed to
rpart.plot::rpart.plot()
See also
Other plotting:
plot.cjdiag_crt(),
plot.cjdiag_forest(),
plot.cjdiag_importance(),
plot.cjdiag_nmm()