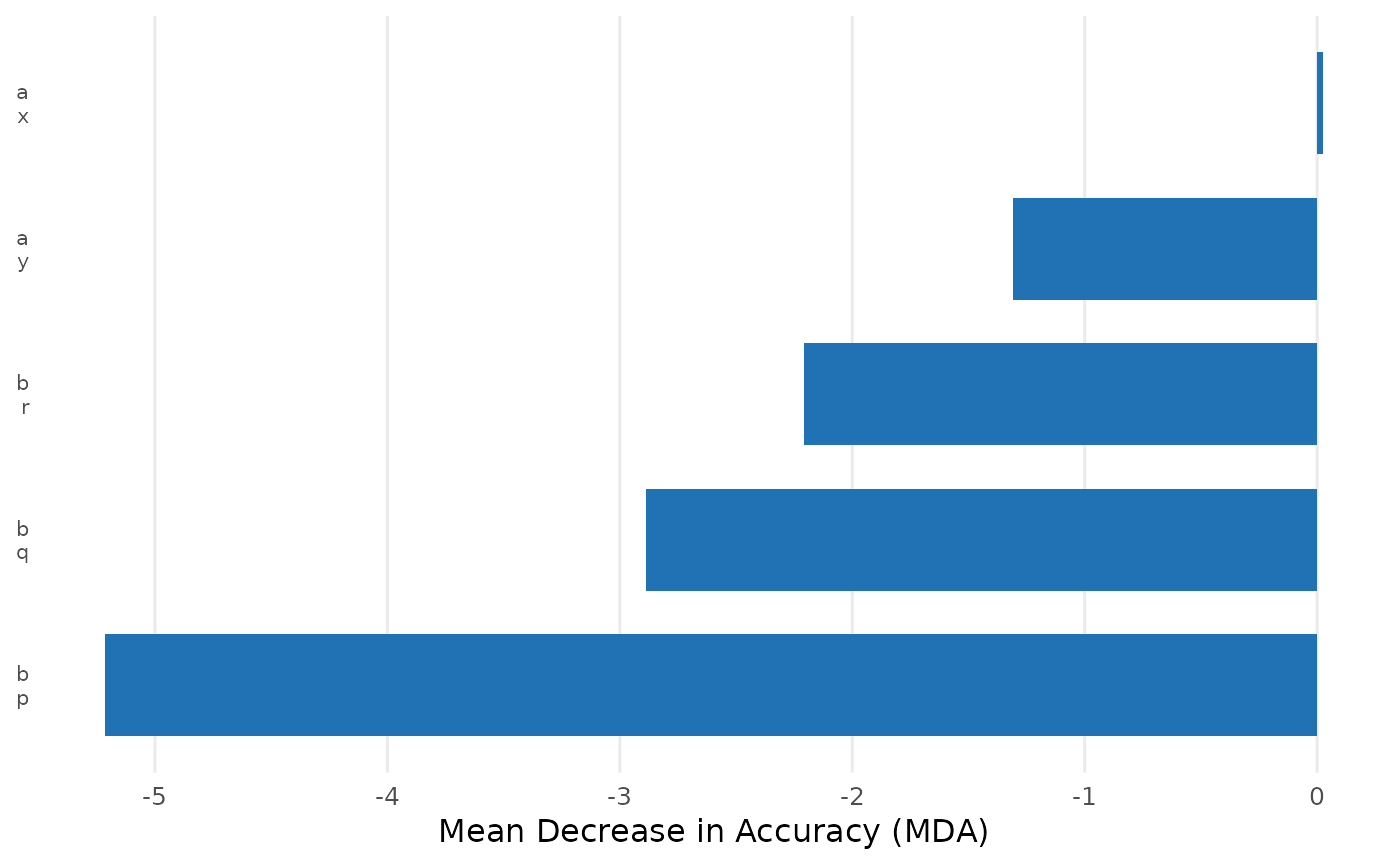
Plot Random Forest Results
Usage
# S3 method for class 'cjdiag_forest'
plot(
  x,
  type = "importance",
  top_n = NULL,
  base_size = NULL,
  colors = NULL,
  palette = NULL,
  theme = NULL,
  label_wrap = NULL,
  attribute.names = NULL,
  level.names = NULL,
  group_by_attribute = FALSE,
  ...
)
Arguments
- x
A
cjdiag_forestobject fromcj_fit()- type
Plot type:
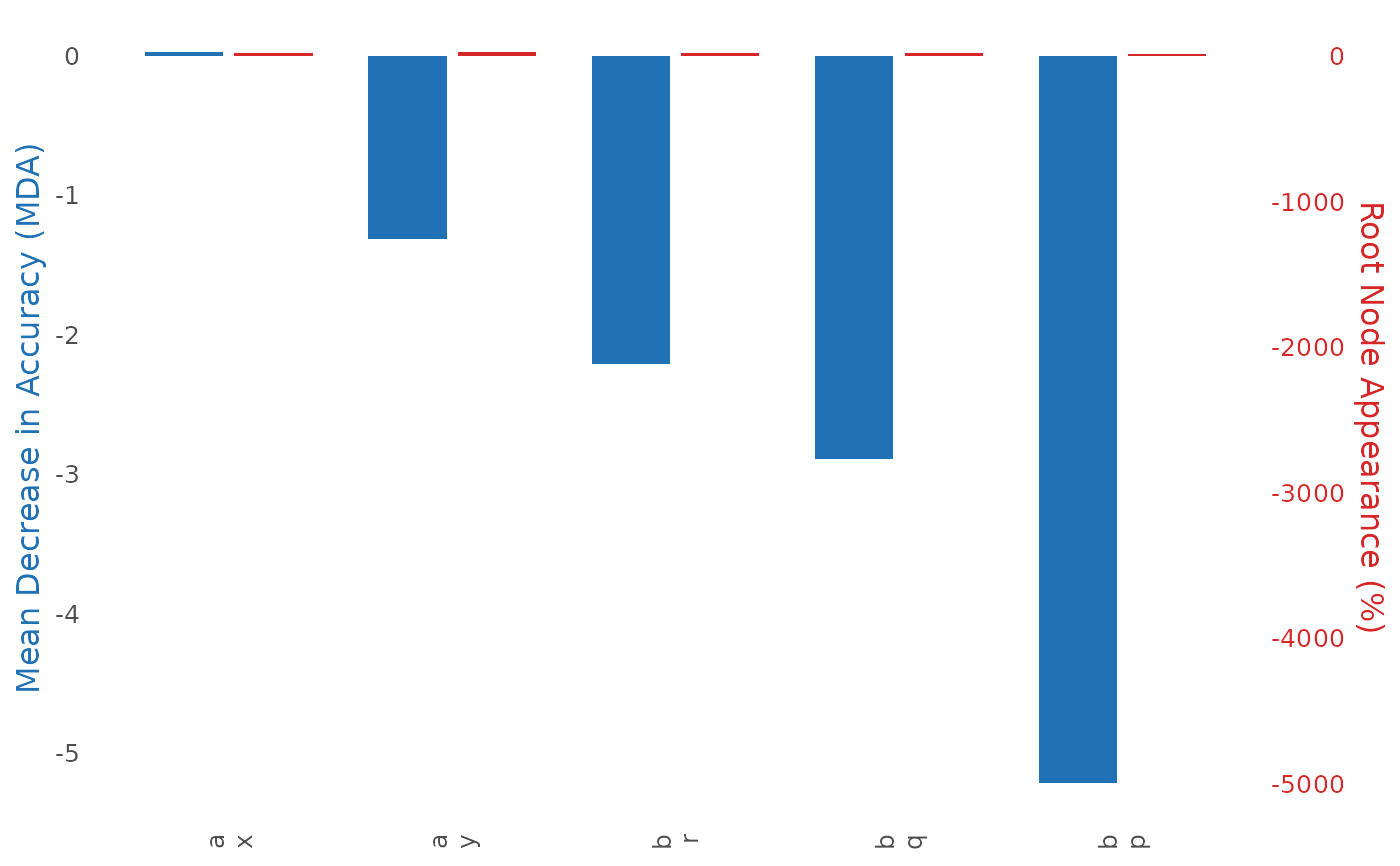
"importance"(default),"combined","rank","cumulative"(MDA rank-decay with labels), or"cumulative_pct"(cumulative % of total MDA, area chart like NMM cumulative)- top_n
Number of levels to display (default 25; NULL = all levels). For
"cumulative", defaults to all levels if not specified.- base_size
Font size (default from global options or 12)
- colors
Named character vector overriding specific palette colors
- palette
Palette name:
"default","colorblind", or"grey"- theme
A complete
ggplot2::theme()object (overrides all theme defaults)- label_wrap
Character width for label wrapping (default 35)
- attribute.names
Named character vector renaming attributes in display
- level.names
Named list for renaming levels
- group_by_attribute
Group levels by attribute with visual separators (default
FALSE)- ...
Additional arguments passed to primary ggplot2 geom
See also
Other plotting:
plot.cjdiag_crt(),
plot.cjdiag_importance(),
plot.cjdiag_nmm(),
plot.cjdiag_tree()