Plot CRT/HierNet Results
Usage
# S3 method for class 'cjdiag_crt'
plot(
  x,
  type = "robustness",
  top_n = 25L,
  base_size = NULL,
  colors = NULL,
  palette = NULL,
  theme = NULL,
  label_wrap = NULL,
  attribute.names = NULL,
  level.names = NULL,
  ...
)
Arguments
- x
A
cjdiag_crtobject fromcj_fit()- type
Plot type:
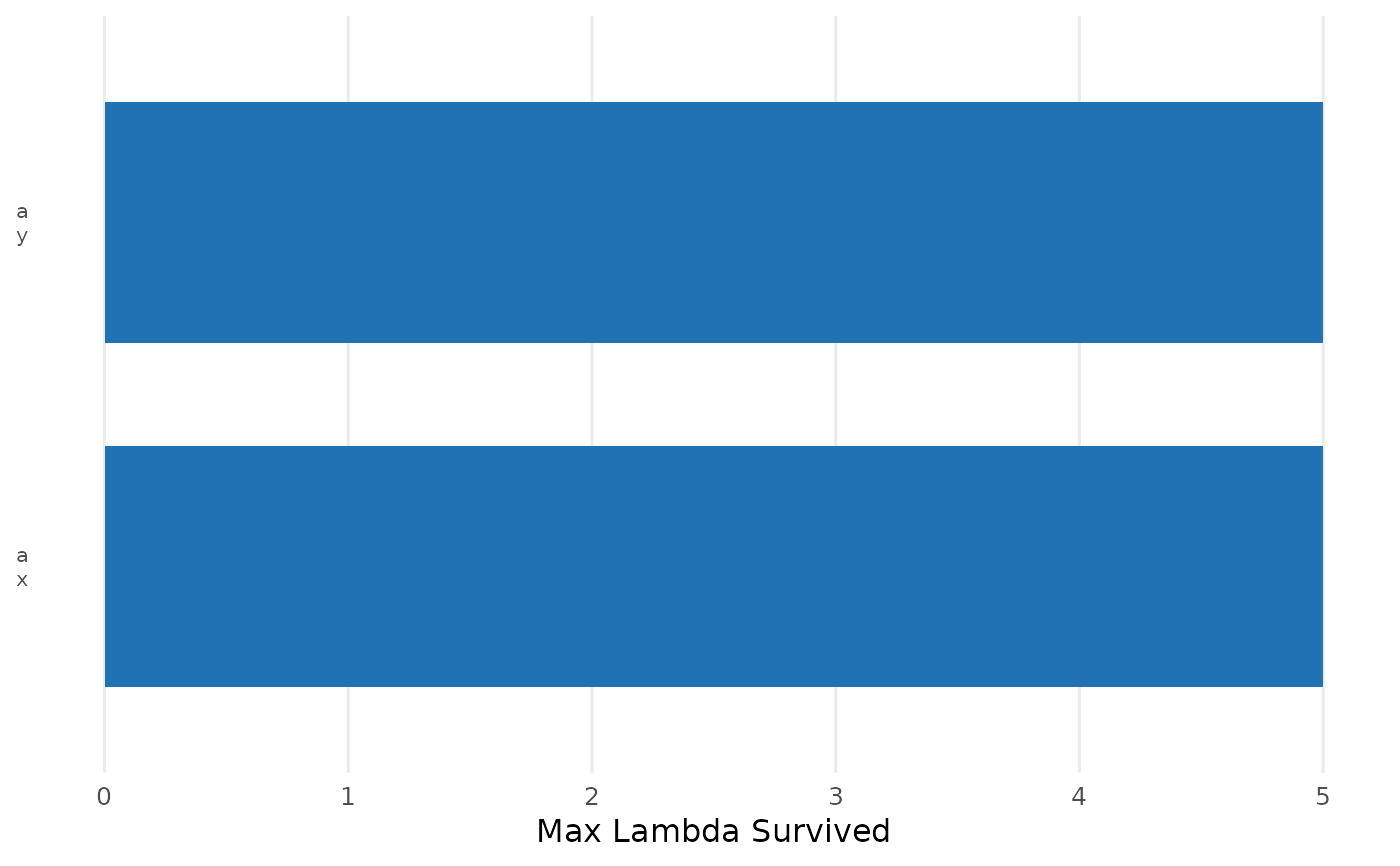
"robustness"(default),"survival","rank","mda", or"cv"."rank"is a connected-dot plot of each level's survival statistic (max \(\lambda\) at which the coefficient is nonzero), ordered from most to least attended.- top_n
Number of levels to display. Default
25for"robustness","mda","rank", and"survival". PassNULLto show every level.- base_size
Font size (default from global options or 12)
- colors
Named character vector overriding specific palette colors
- palette
Palette name:
"default","colorblind", or"grey"- theme
A complete
ggplot2::theme()object (overrides all theme defaults)- label_wrap
Character width for label wrapping (default 35)
- attribute.names
Named character vector renaming attributes in display
- level.names
Named list for renaming levels
- ...
Additional arguments passed to primary ggplot2 geom
See also
Other plotting:
plot.cjdiag_forest(),
plot.cjdiag_importance(),
plot.cjdiag_nmm(),
plot.cjdiag_tree()
Examples
# \donttest{
# CRT requires the hierNet package
if (requireNamespace("hierNet", quietly = TRUE)) {
  df <- data.frame(
    y = sample(0:1, 200, TRUE),
    a = factor(sample(c("x","y"), 200, TRUE)),
    b = factor(sample(c("p","q","r"), 200, TRUE))
  )
  crt <- cj_fit(y ~ a + b, data = df, method = "crt",
                 lambda_grid = c(5, 10), n_folds = 2, n_perm = 2)
  plot(crt, type = "robustness")
}

# }
# }